The Problem 😱
In case you click on a process start or task or on a button on a HTML Dialog and the browser is loading endlessly and no further page is shown, then you may have an endless loop in your process or Java class or, even worse, a deadlock. Sometimes you may also find the following log in your log files:
"The following threads seems to loop endless or are blocked:"

    HTTP GET Business Processes/core.mod/start2.ivp(2.2.0.0) [Executing since 9 minutes]

      at 179A4023CC765549-f6 - core - designer/core$1
How can you find out where the problem is in your process or Java class?
What tools can you use to analyze the problem?
Designer 🧐
If you have an endless loop log entry, the entry will show you the id of the process element (PID) where the process is looping. Use the Axon Ivy Search (CTRL+H) to find the process elements with the mentioned PIDs. Analyze the process and check if it is possible that it loops endlessly. Also, the ivyScript on the process element can produce an endless loop or it could be a Java class you are calling from the process element.
If you don't have an endless loop log entry, try to reproduce the problem in the Designer and activate the animation to see which process step is currently getting executed.
Performance Statistic 📡
If you are not able to reproduce the problem in the Designer activate the performance statistic on the Engine. When activated, the Engine will periodically create a new *.csv file. In the file you will find the number of executions of each process element. If you see that certain process elements are executed a lot of times use their PIDs to find them in the Designer and analyze the process.
JPS and JStack 🏗
If the endless loop is located in an ivyScript or Java class, it might be hard to find them by simply analyzing the code. In this case you can use the jps and jstack tools from a Java Development Kid (JDK). To use them you need to first install a JDK on your system. Then use the jps command to list all running Java processes on your system.
>jps -m

14720 Elasticsearch -Ehttp.port=19200 -Ecluster.name=ivy-elasticsearch-2323908275674164622 -Epath.data=C:\Users\rwei\AppData\Local\Temp\elasticsearch-data-ca126f77-6055-41c5-8876-931a5dd07841

6688 Jps -m

19420 Main -nl en -application ch.ivyteam.ivy.server.exec.engine -console
This prints the process id of each Java process and the command line it was started with. In the example above the process with the id 19420 is the Axon Ivy Engine.
Now use the jstack command to create a Thread Dump.
jstack 19420 > threaddump.txt
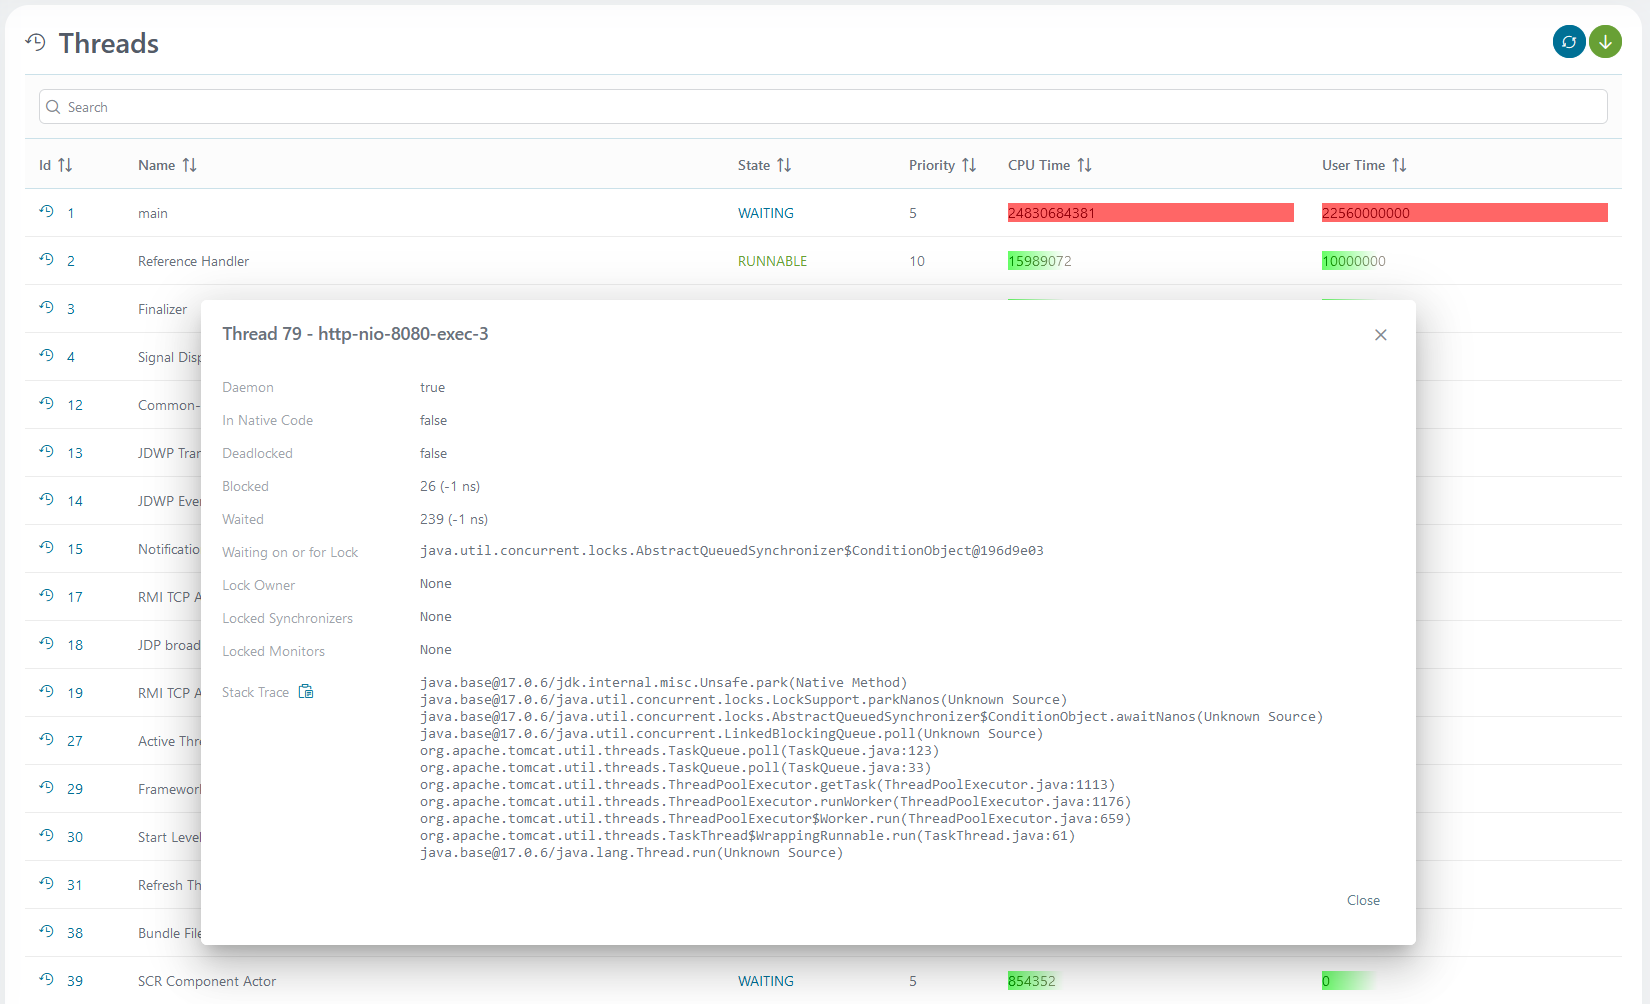
This will dump all threads of the Engine with their current Java callstacks to the threadump.txt file. There will be a lot of threads in the file. Have a look at the threads with large callstacks and with names that start with http-nio or https-nio; these are the threads that drive HTTP requests. Also threads with names that start with ivy immediate job or ivy background operation are interesting as these execute System Tasks or calls to external systems like database queries or SOAP requests.
Take more than one Thread Dump, each a few seconds apart. Then look for threads that have almost the same call stack in all dumps. The most likely place to find the endless loop is in the topmost Java method that is common in all these stack trace entries.
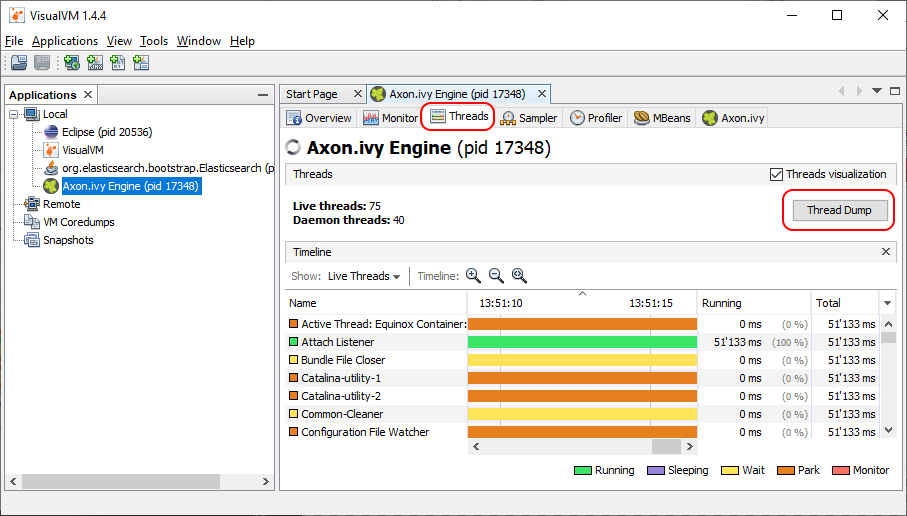
Visual VM 🎇
If you don't like to work on the command line you can also take Thread Dumps using VisualVM. Visual VM is a program that offers a lot of Java monitoring and analyzing features with a modern user interface.
Windows Service ⚙
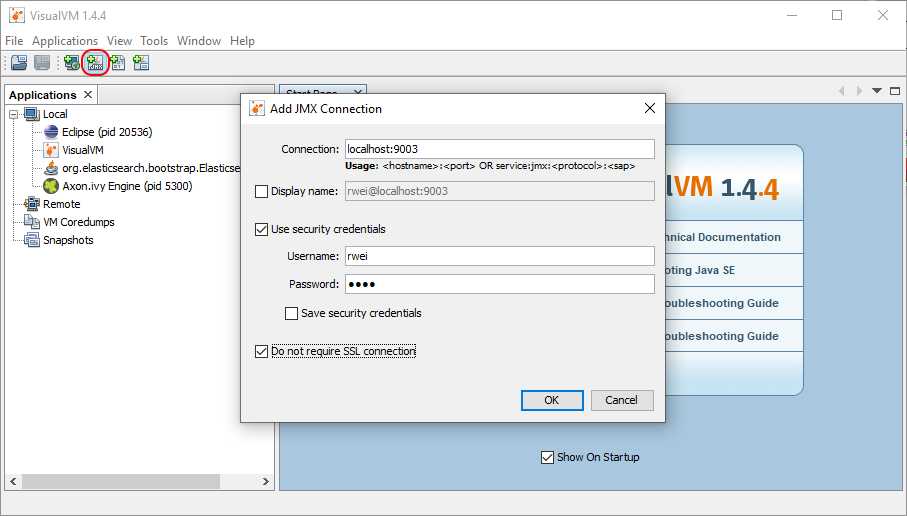
If the Axon Ivy Engine process is not displayed with the JPS command or it is not displayed in the Applications view of VisualVM then the Axon Ivy Engine might be running as Windows Service or with another Linux user. In this case activate remote JMX access on the Axon Ivy Engine. Then use VisualVM to establish a remote JMX connection to the Engine.
I'm sure with help of these tools you will be able find any endless loop in your processes.