Every now and then I attend to clients who come to us with a session leak. Sometimes the cause is to be found in the projects, but the platform itself is not error-free either.
How do we deal with this? We have to ask a lot of questions about the implementation of the projects, do small tests, understand the whole integration with the surrounding systems like the reverse proxy. Most of the time we end up providing a patch to get even more information out of the system.
This is: Tedious, time-consuming and expensive. 😵!
And don't forget: A session leak only happens on a productive environment (trust me 😉). That means you need to be fast as well! Nobody can ever guarantee that any code is 100% safe and session-leak free. So I'm pretty sure it will happen again, but then we need a proper tooling to detect the root cause. And this is what I bring to you!
Say Hi 🤚 to the session monitor
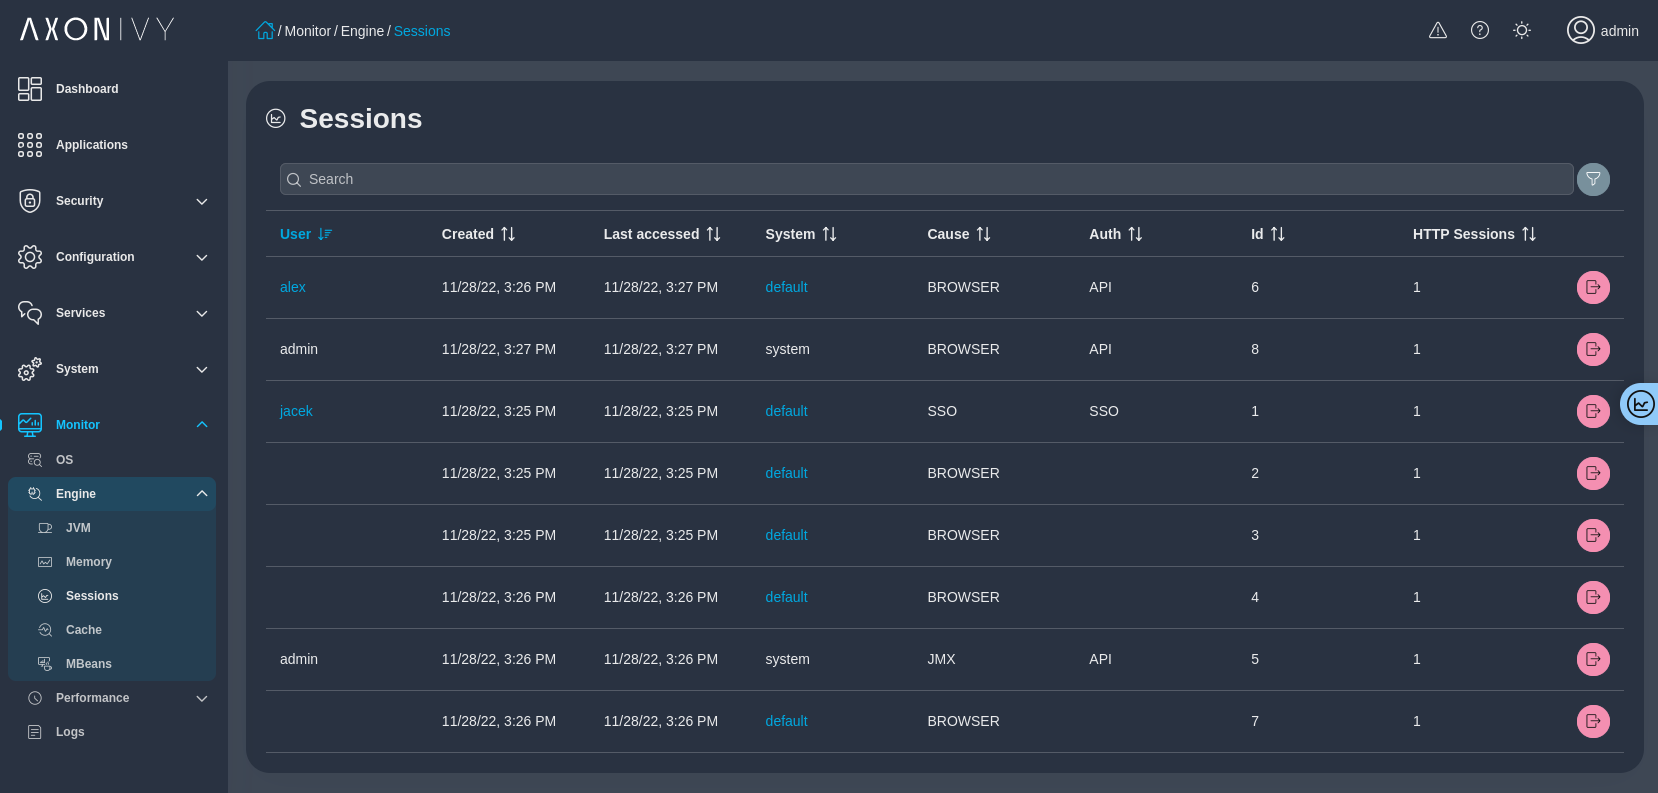
Jump in the Engine Cockpit, go to Monitor and click on Sessions. You will see all open ivy sessions. We added useful infos to each session:
- Creation Time
- Last accessed
- Cause, which stack was the driver for the session creation
- Auth, additional info how the user was authenticated on this session
- Http Sessions, if there are active http sessions associated
... and some more useful informations when inspecting session leaks.
Ivy Session vs. HTTP Sessions
When we talk about sessions, we usually talk about ivy sessions. This is what you pay for. But we also have HTTP sessions. One ivy session can have one or multiple HTTP session. A HTTP session is for one ivy application. This is designed that applications lives isolated to each other.
Backported to LTS 10
This feature will come with our next Leading Edge release (11.1). But this feature is so much important, that I've decided to port it back, which is already available in 10.0.1 and even more improved in the upcoming 10.0.2 release.